
Measure the impact of your events — with facts, not gut feeling
Create a professional event report in seconds.


THE PROBLEM
After every event, you're asked: 'Was it worth it?'
You're expected to document impact, convince decision-makers, and renew sponsors — but you don't have credible numbers to show.
Budget scrutiny
Funding decisions require evidence — not photos and 'it felt busy.'
Stakeholder pressure
City leadership, partners, and businesses want proof before they back the next event.
Sponsor uncertainty
Without documented reach, sponsors hesitate to renew or increase support.
No shared truth
Different teams use different assumptions — and the discussion becomes opinions, not facts.

“With Plaace, we’ve finally gained concrete data on the city center in Næstved. It makes it easier to document the impact of events and make decisions based on facts – not gut feeling.”

Nicolaj Lund Jensen
Citychef at Næstved City
See it in action
A quick walkthrough of creating an event impact report in minutes.
DATA QUALITY
Data you can trust
Movement insights from Telia, the Nordics' leading telecom operator — aggregated, anonymized, and GDPR-compliant.
Aggregated mobile network data
Based on millions of devices across Telia's network — not samples or surveys.
Fully anonymized
No personal data. No tracking. All insights are aggregated at the area level.
GDPR compliant by design
Built with privacy first. Methodology notes are included in every report for full transparency.
Try it on your next event
Create an event report in minutes — then share it with stakeholders.
THE SOLUTION
This is the event report you'll share
Telia movement data from millions of mobile devices.
- Telia movement data
- Aggregated & anonymized
- GDPR compliant
- Methodology included
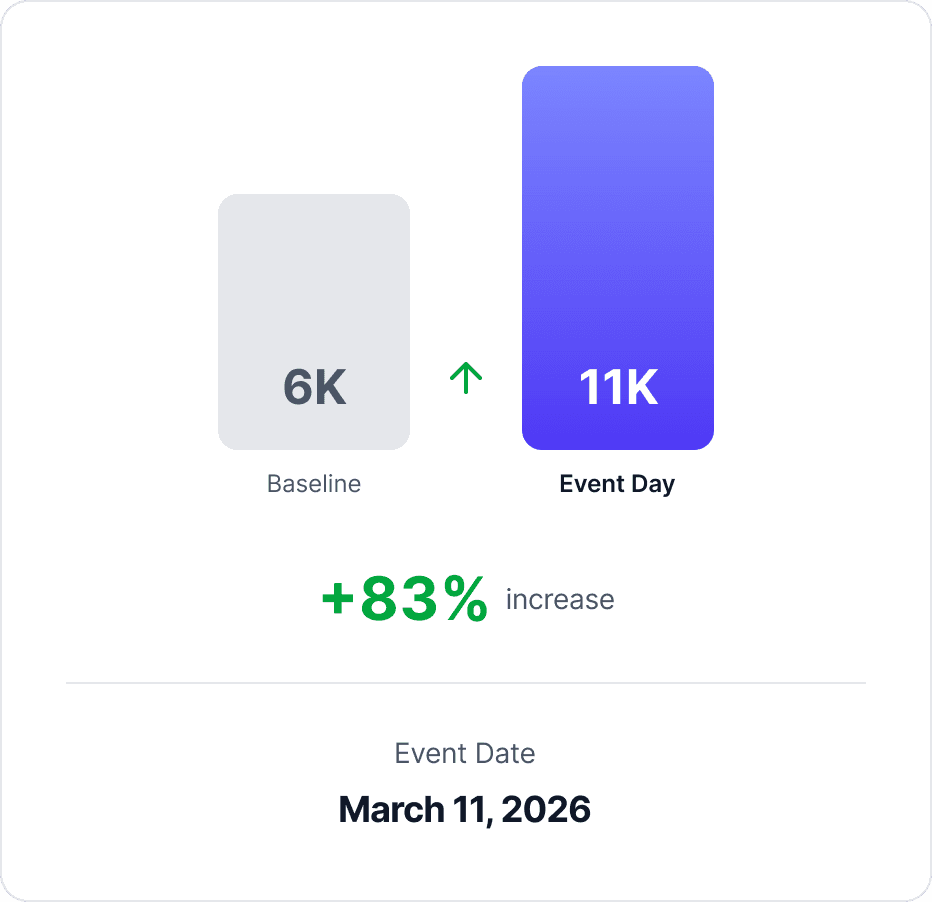
Compare event vs. baseline
See the exact impact by comparing visitor counts on event days vs normal days. Show the precise percentage uplift.
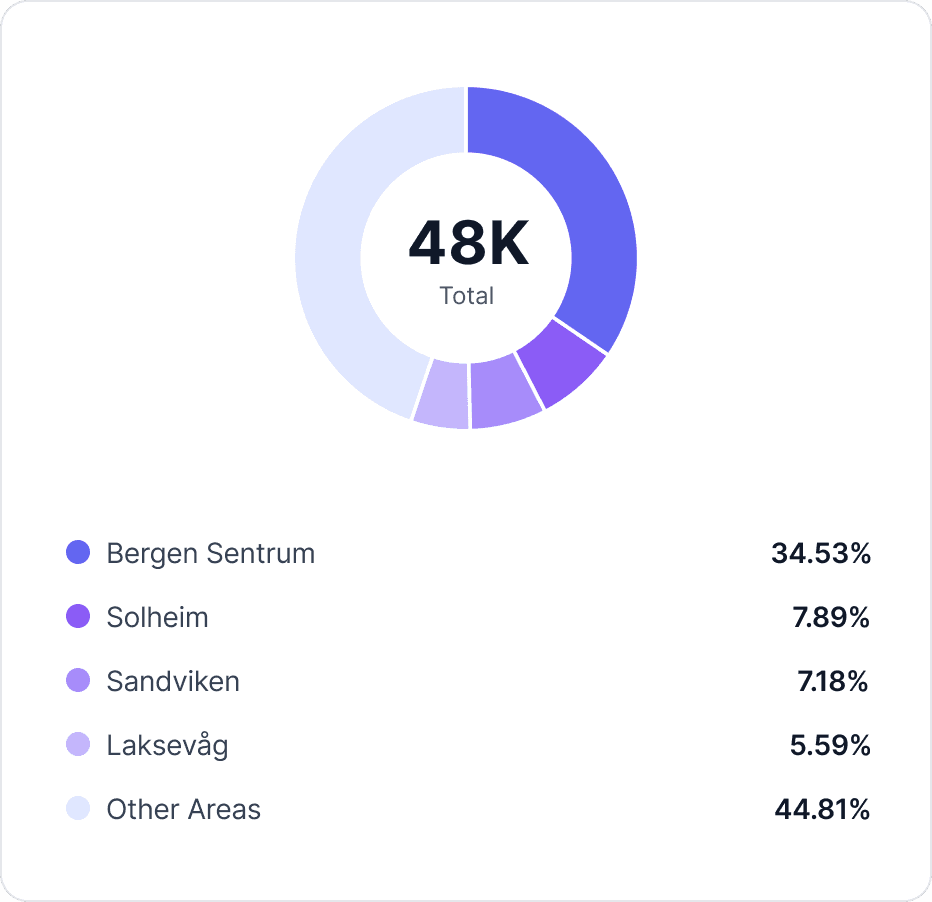
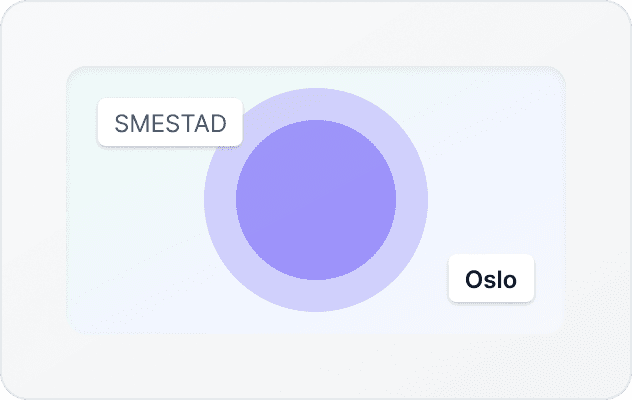
See where visitors came from
Understand geographic reach: which municipalities and districts visitors traveled from. Show the event draws people from outside — not just locals.
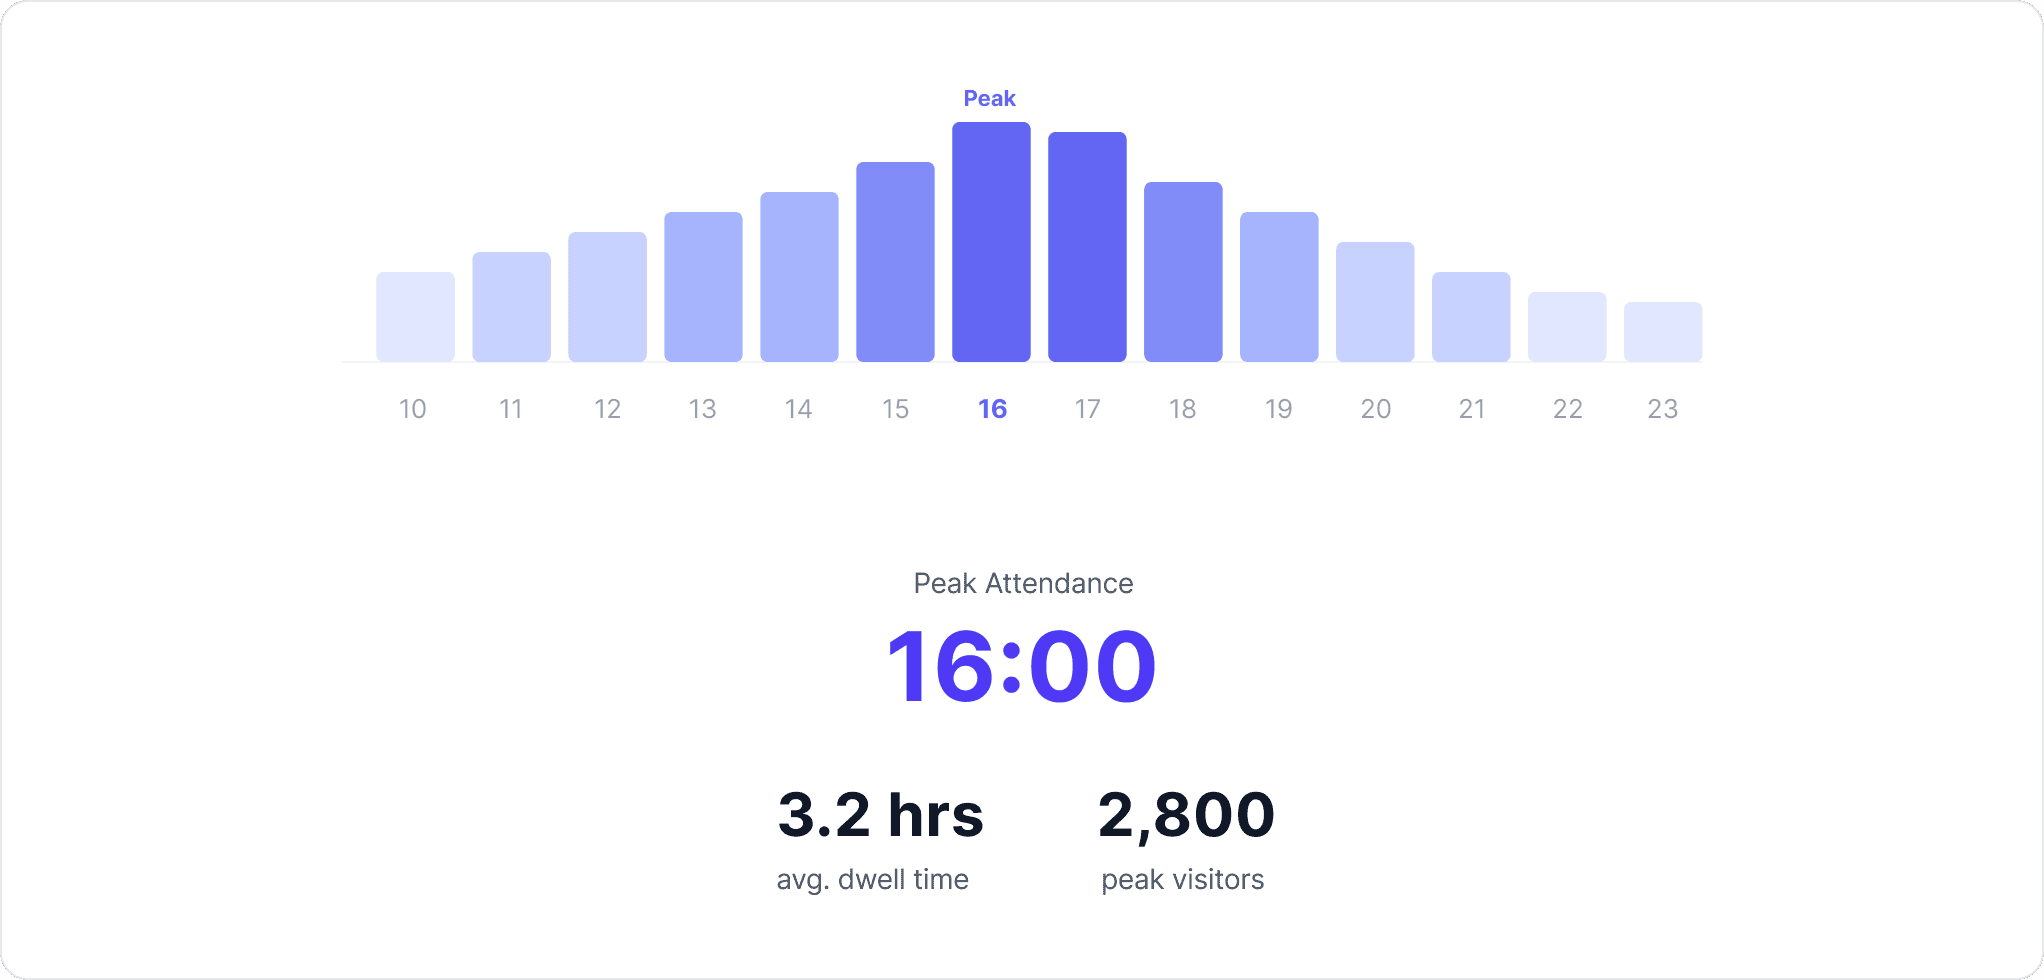
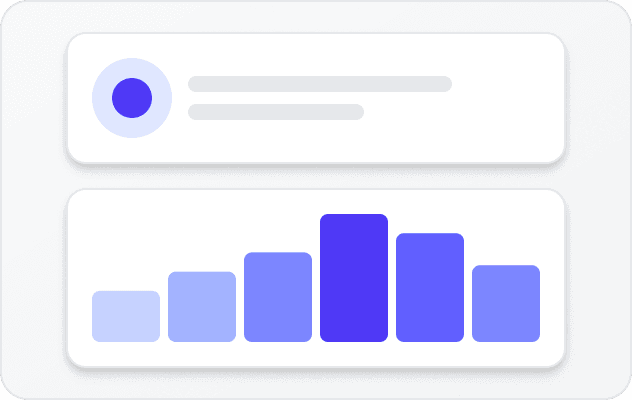
Peak times and dwell time
See when people arrived, how long they stayed, and when attendance peaked. Use the insight to plan the next event better.
SIMPLE AND FAST
Finished report — in 30 seconds
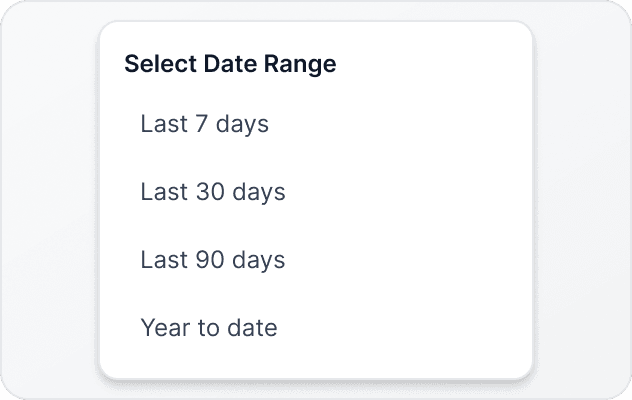
Choose event dates
Select the exact days the event ran. Takes 5 seconds.
Define the area
Draw the event zone on the map. Takes 10 seconds.
Get the report
Dashboard generated instantly. Takes 15 seconds.
Simple and accessible
Event Report
One-time payment per event report
5 000 NOK
- 1 event report
- Visitor count + timing + origins
- Event vs. baseline comparison
- Peak times and dwell time
- Shareable dashboard link
- PDF export
- Methodology note included
No long setup. No subscription.
Questions and answers
Create a share-ready event impact report in minutes
Ready in 30 seconds. Share with the board, sponsors, and politicians.