
The Demographic Report for Any Area in the Nordics
A finished dashboard with age distribution, household income, household types, and population — for any catchment in the Nordics.


THE PROBLEM
Knowing how many people visit an area is only half the picture
Visitor data tells you how many, not who. You can't judge whether the audience matches your offering without demographics.
You Know How Many — Not Who
Footfall and visitor counts tell you nothing about who people are. You can't judge whether the audience matches your offering.
Loyalty Data Is Too Narrow
Only a fraction of customers sign up. CRM and loyalty data do not represent the full catchment area.
Manual Work With Raw Data
SSB and SCB give you raw tables — not finished catchment reports. Hours of Excel work for a single location.
Stale Consulting Reports
One-off reports are expensive, slow, and already outdated when delivered. Impossible to repeat for new locations.

“Plaace supports us in our expansion efforts by providing comprehensive insights into demographics, visitor numbers, and the competitive landscape in a single platform.”

Finn Dybdalen
Etableringsdirektør at Bitastad
See It in Action
A quick walkthrough of creating a demographic report in 20 seconds.
DATA QUALITY
Data You Can Trust
Official population data from the Nordic statistics agencies — aggregated, anonymised, and GDPR compliant.
Official Population Data
From SSB, SCB, Statistics Denmark, and Statistics Finland — not samples or surveys.
Fully Anonymised
Aggregated population statistics. No personal data, no tracking — area-level only.
GDPR Compliant by Design
Built with privacy first. Methodology notes are included in every report for full transparency.
Create Your First Demographic Report
Generate a demographic report for any Nordic area — in 20 seconds. Free, no setup.
THE SOLUTION
Everything You Need to Know About Your Catchment
Official population data from the Nordic statistics agencies — aggregated at the catchment level.
- Interactive Map Exploration
- Real-time Data
- GDPR Compliant
- 20 Second Delivery
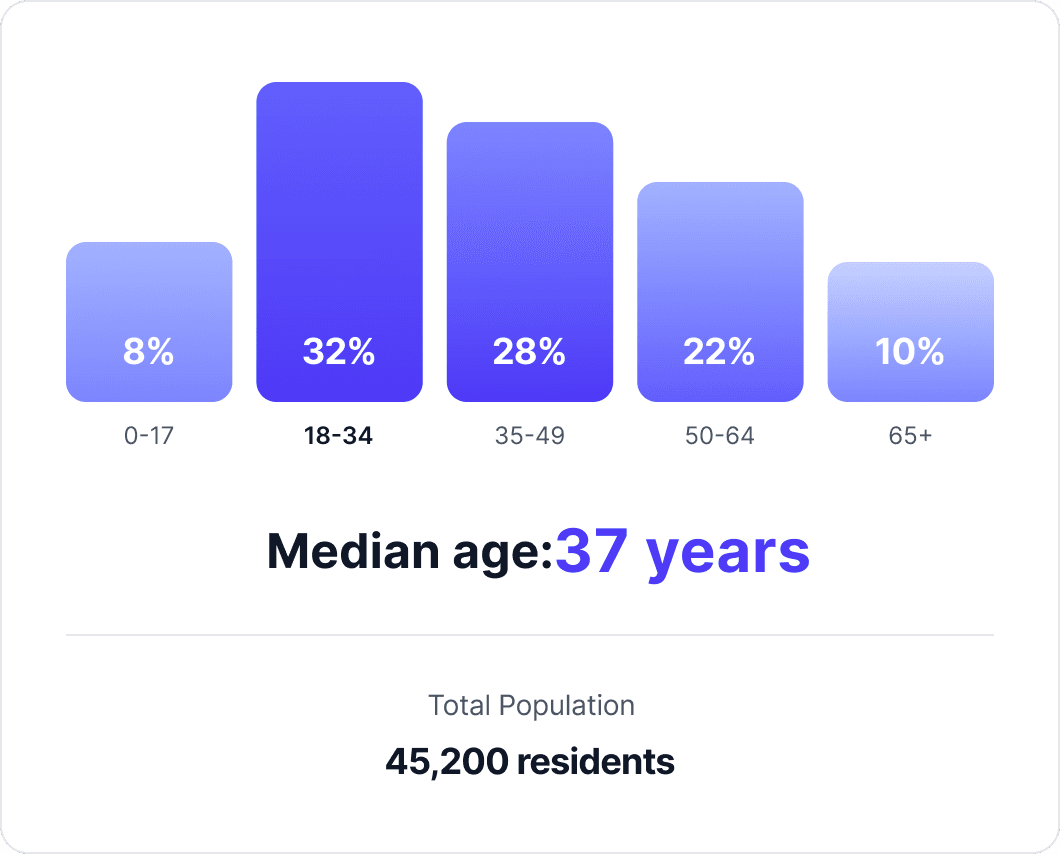
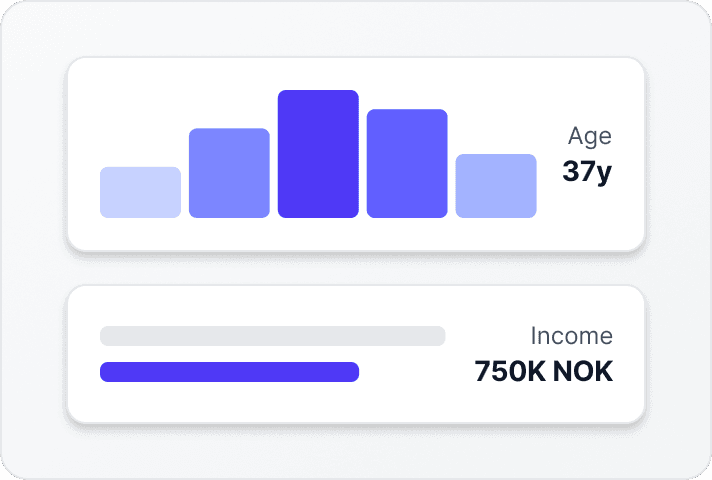
Age Distribution Insights
Understand the age profile of your catchment and align your offering with the local population. See median age, distribution across five cohorts, and total population.
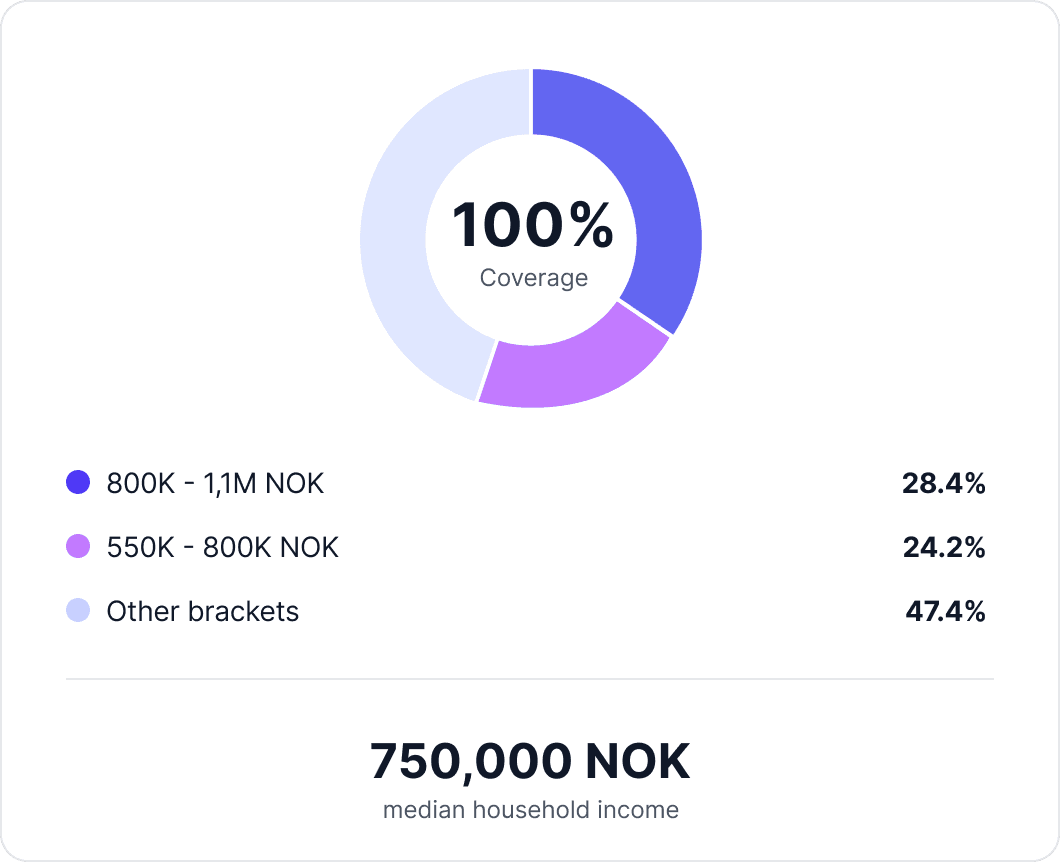
Household Income Distribution
Identify income levels in your target area to optimise pricing and positioning. See median household income and distribution across brackets.
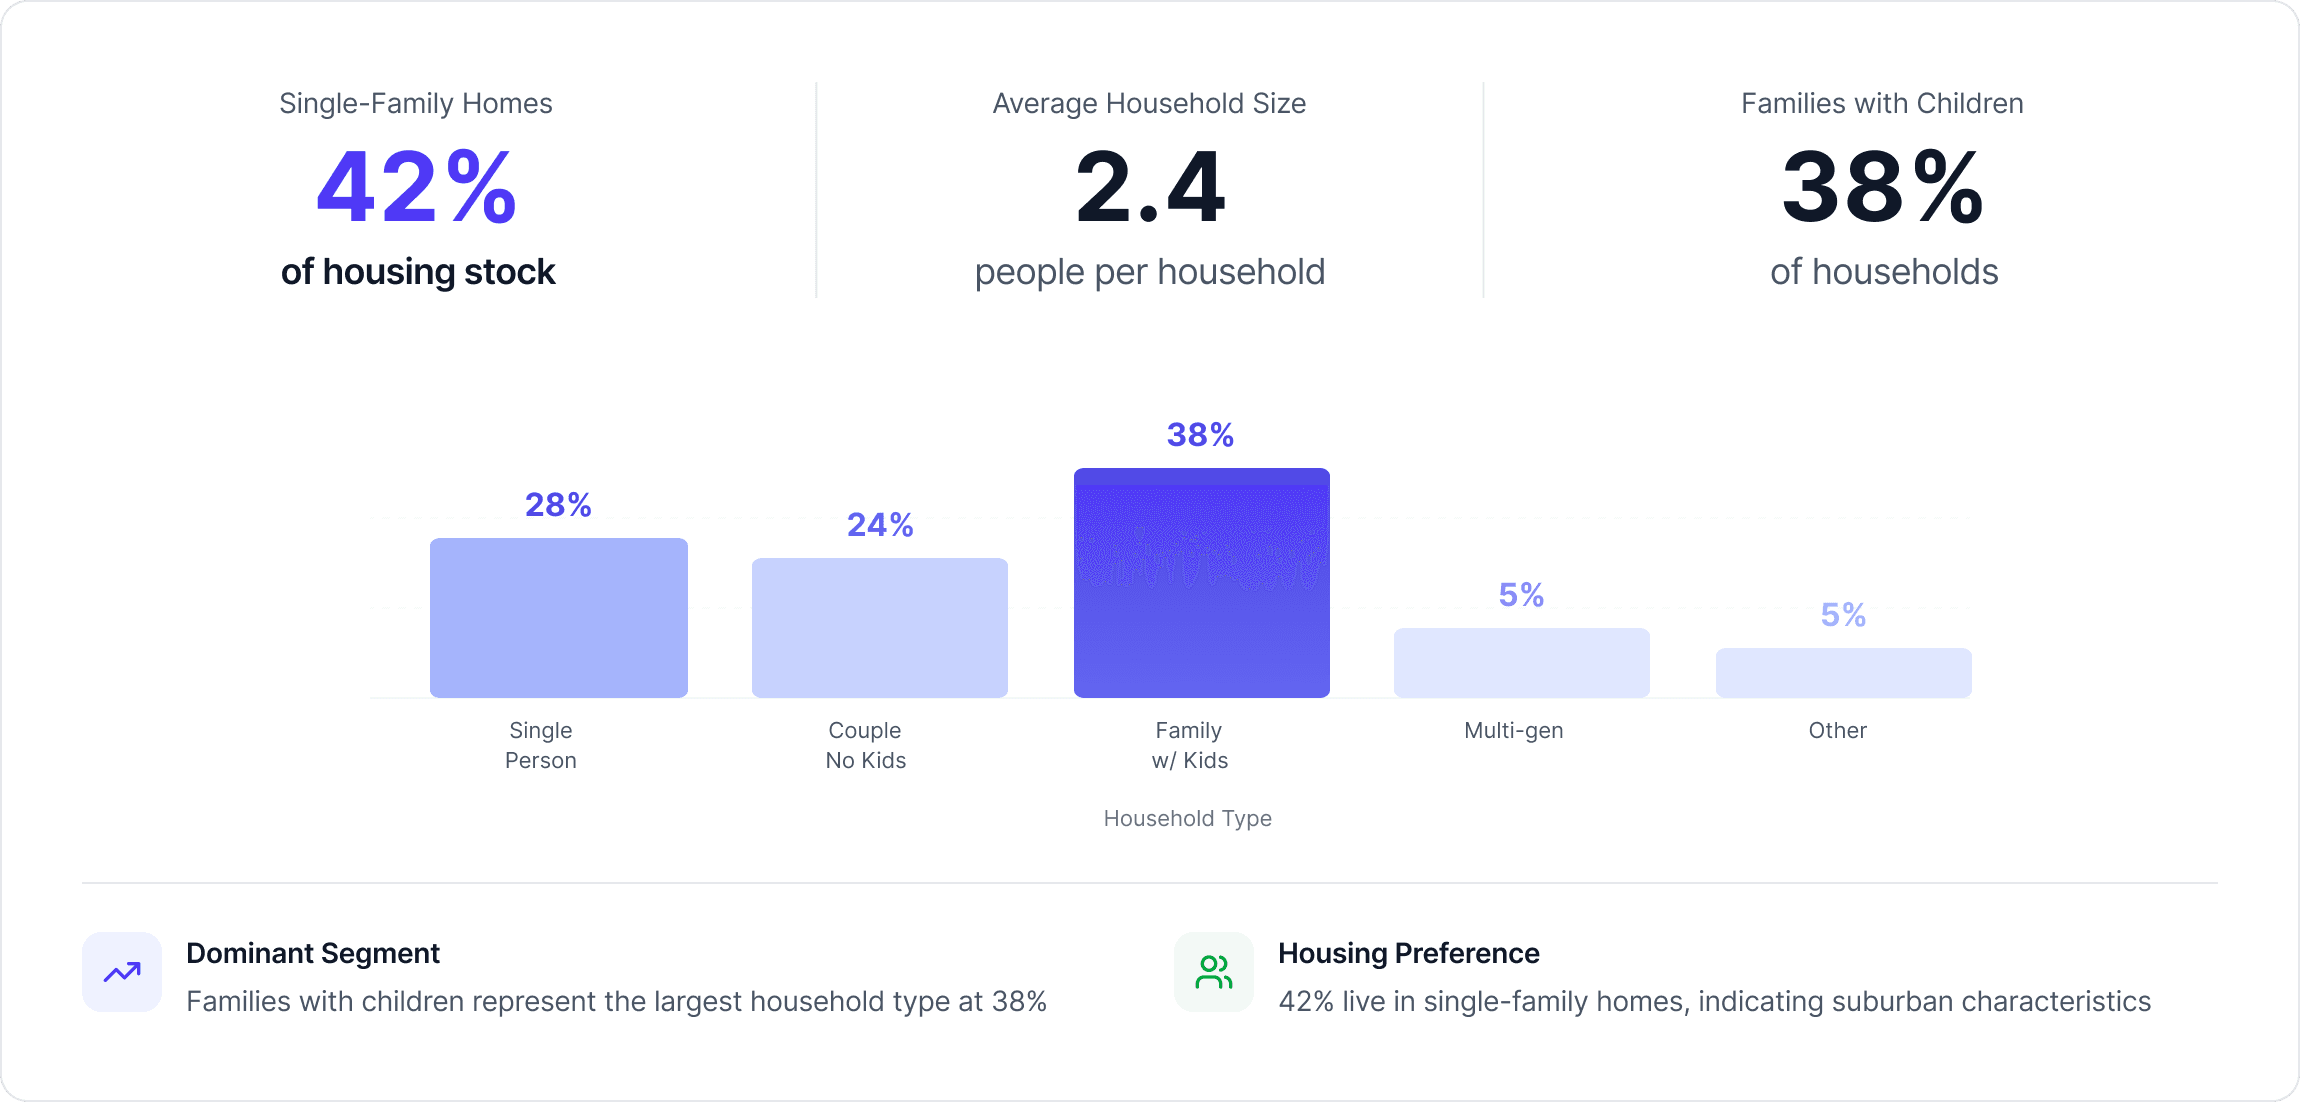
Household Types and Housing Profile
Explore household composition and housing types to tailor your market strategy and service offerings. See share of families with children, average household size, and housing stock.
SIMPLE AND FAST
Finished Report in 20 Seconds
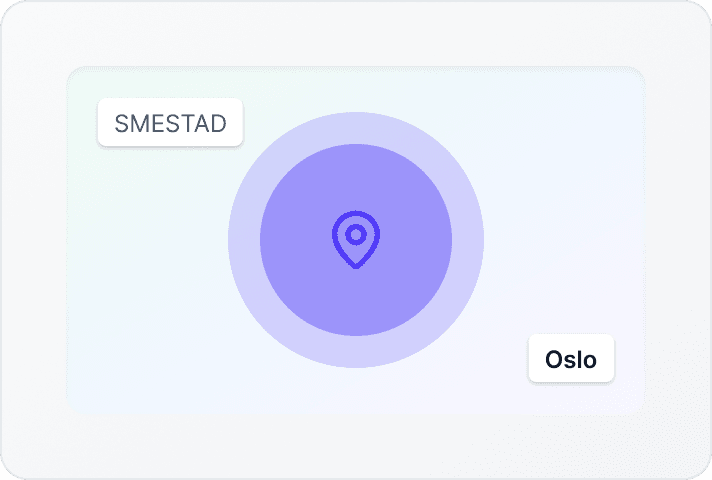
Define the Area
Draw your catchment area on the interactive map.
Get the Report
Comprehensive demographic profile generated instantly.
Simple and accessible
Demographic Report
Complete demographic report for any catchment area
Free
- Age distribution and median age
- Household income and median income
- Household types and housing profile
- Total population in the catchment
- Interactive catchment area definition
- Shareable dashboard link
- PDF export
No long setup. Cancel anytime.
Questions and answers
Your First Demographic Report Is 20 Seconds Away
Free for any area in the Nordics. Draw on the map or enter an address — get the report in 20 seconds.