Dashboards
Build your data story through custom dashboards
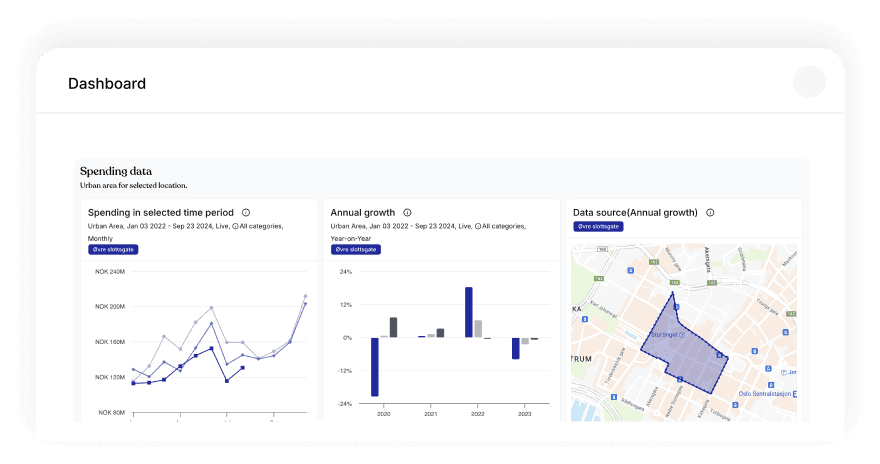
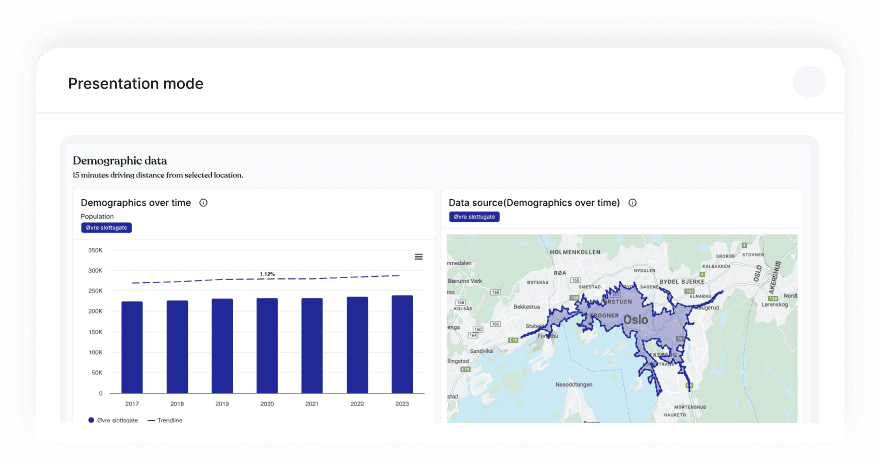
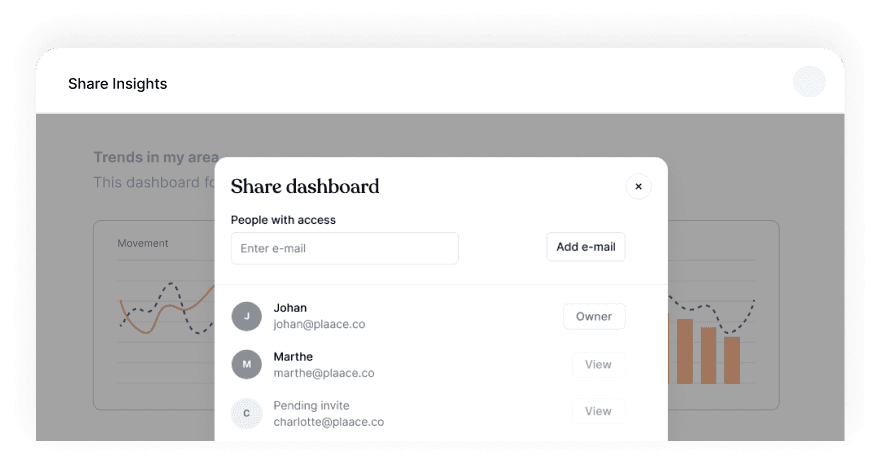
Gather the data that is relevant for you in a custom dashboard and let AI interpret each graph. Add photos, text, and invite your colleagues to collaborate. You can also download a PDF version of your custom presentation to share with external stakeholders.
Personalised insights
Interactive presentations
Share with anyone
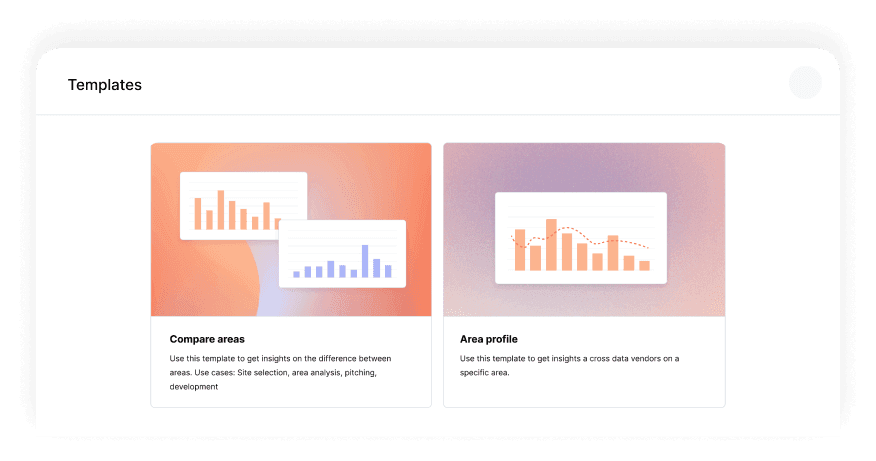
Create from a template
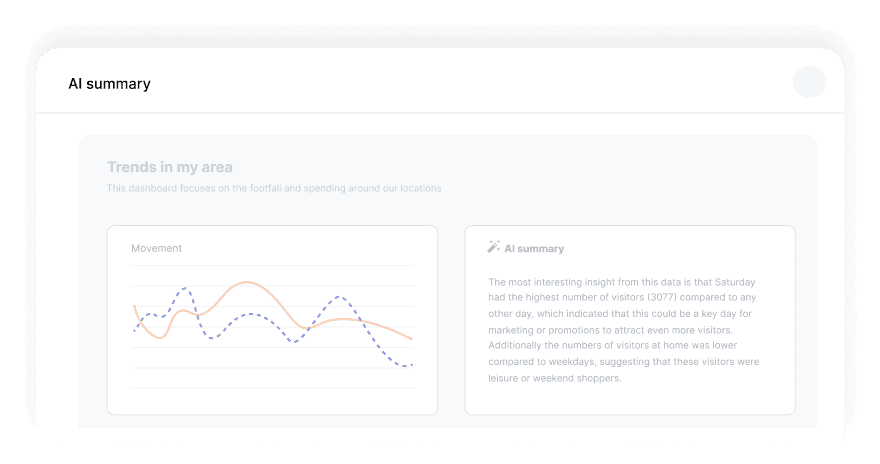
Interpret the data with AI
Related features and data
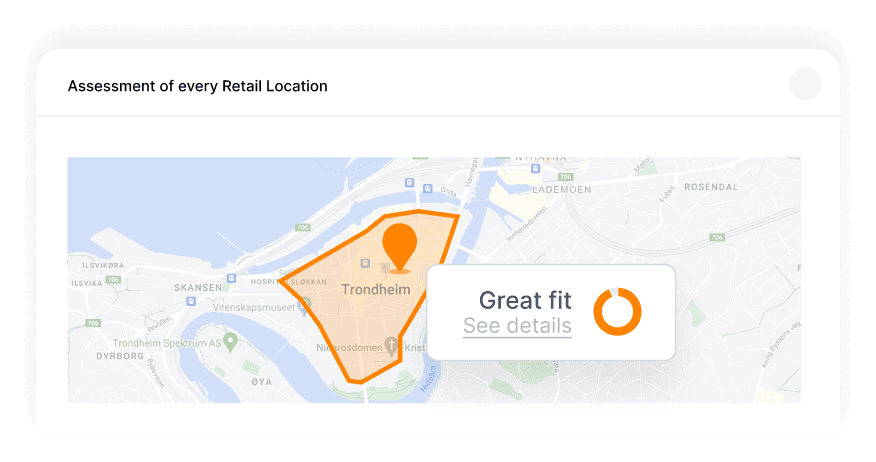
Fit Score
Turn data into powerful insights with our ML and AI models, delivering customised, area-based revenue predictions.
Read more →
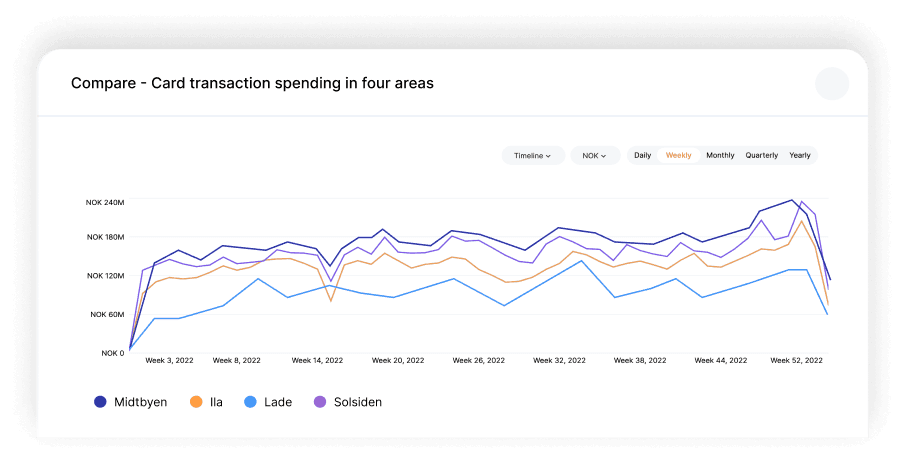
Compare Areas
Benchmark areas and identify growth opportunities by comparing key metrics across multiple locations.
Read more →
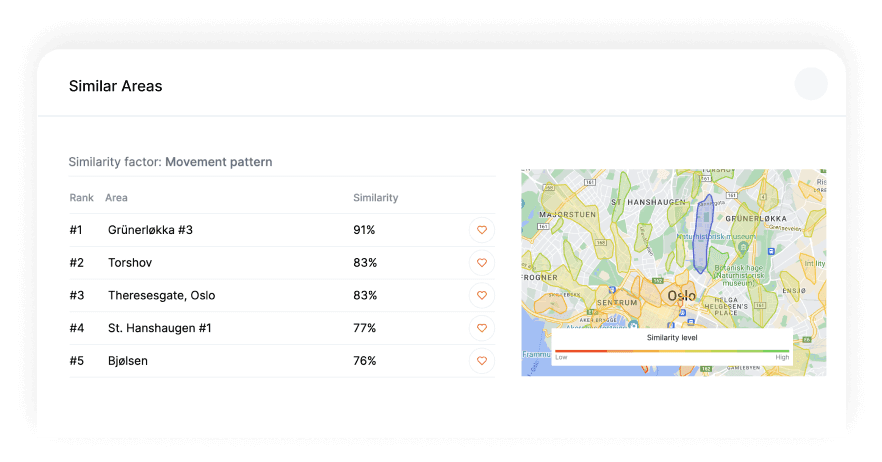
Similar Areas
Turn your top-performing location into a blueprint for success by discovering new areas with similar potential.
Read more →
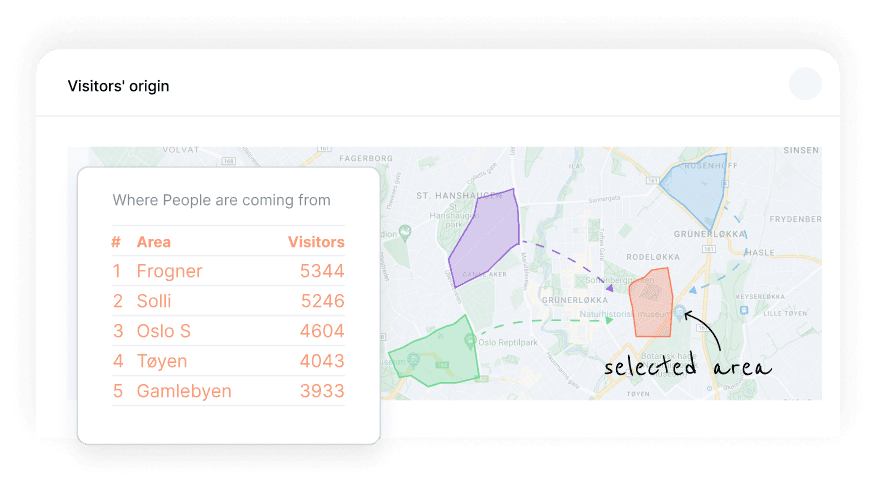
Visitors’ Origin
Discover where your visitors come from and gain a deeper understanding of your true catchment areas.
Read more →
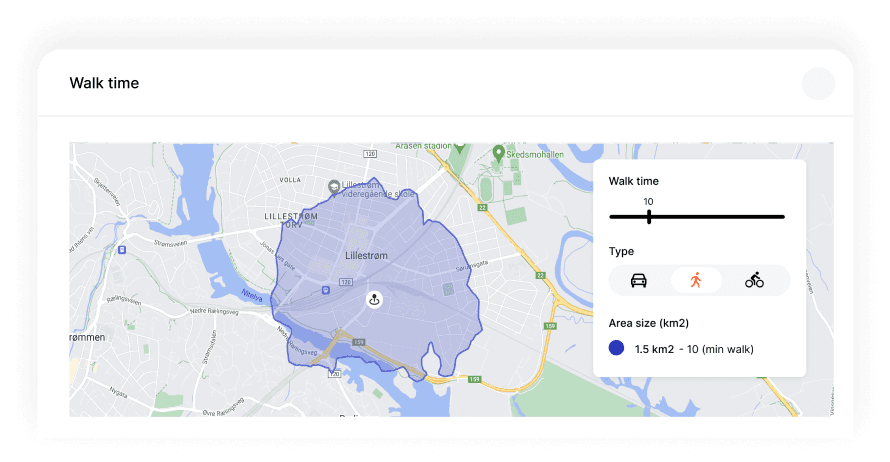
Walk & Drive Time
Select areas based on walking, driving, and cycling times to explore realistic catchment areas.
Read more →