Transaction Data from Nets
Analyse industry trends, geographic patterns, and understand where cardholders come from across the Nordics.
Track card commerce trends across the Nordics with data from Nets
Get insights into card usage across industries and geographies. Municipality-level data shows development across different industries and where cardholders come from — both domestically and internationally. Data is presented in dynamic tables and charts, so you can quickly analyse trends, compare regions and understand consumer behaviour across categories.
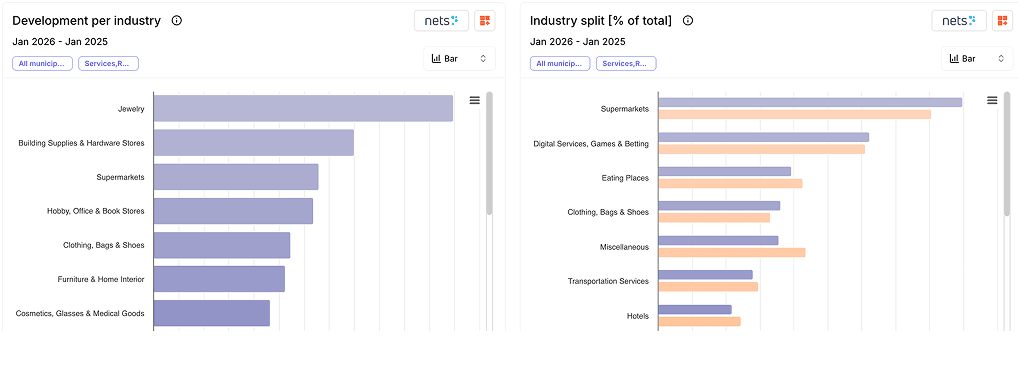
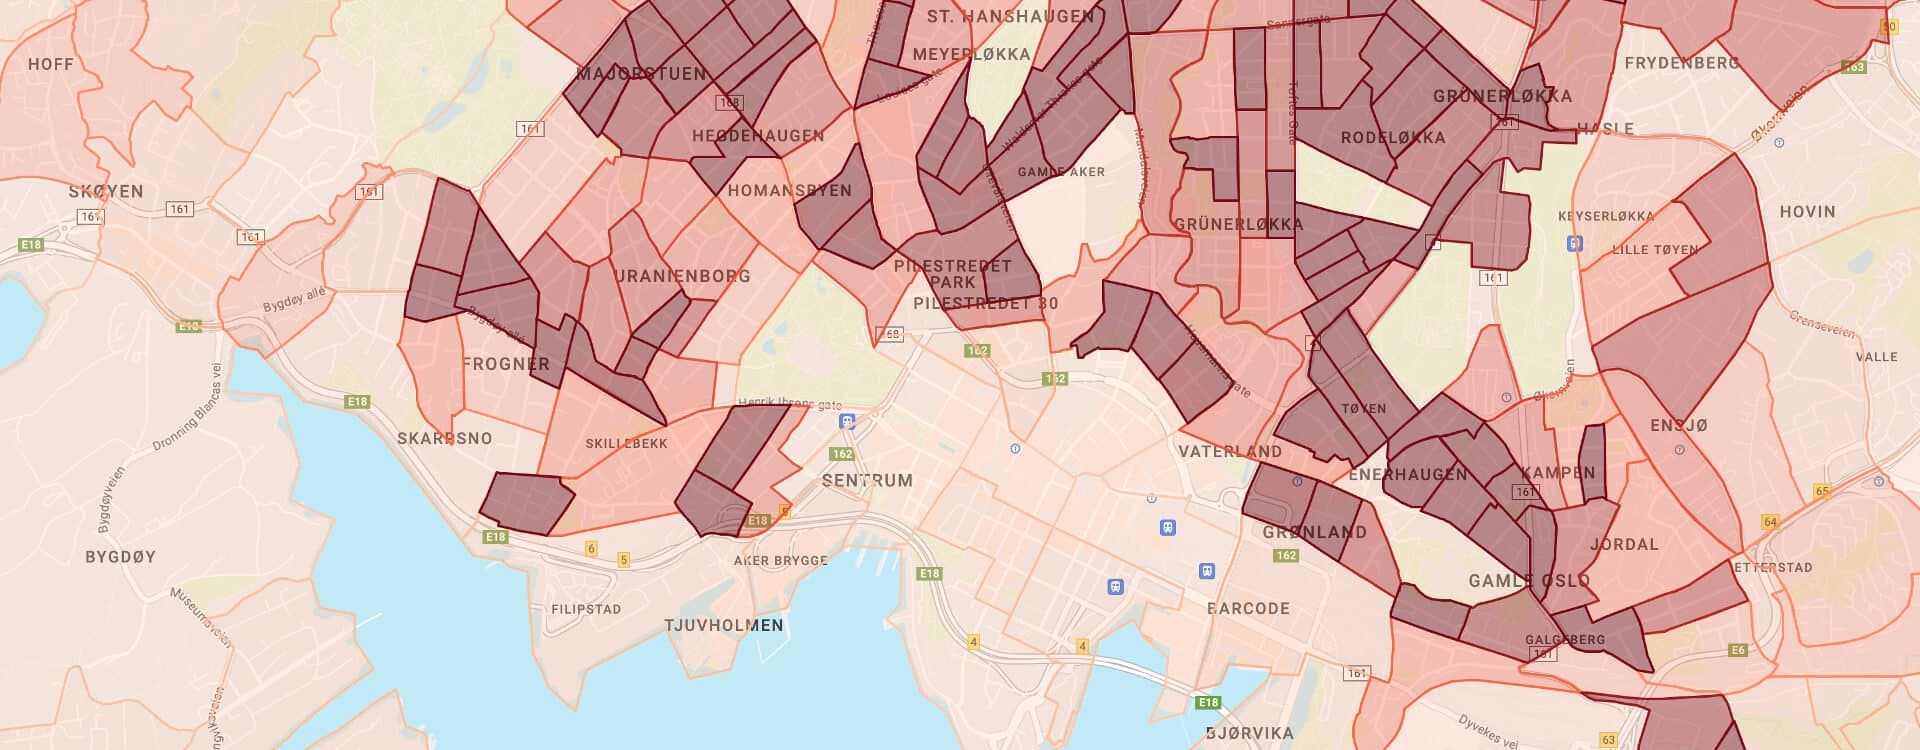
Understand industry development
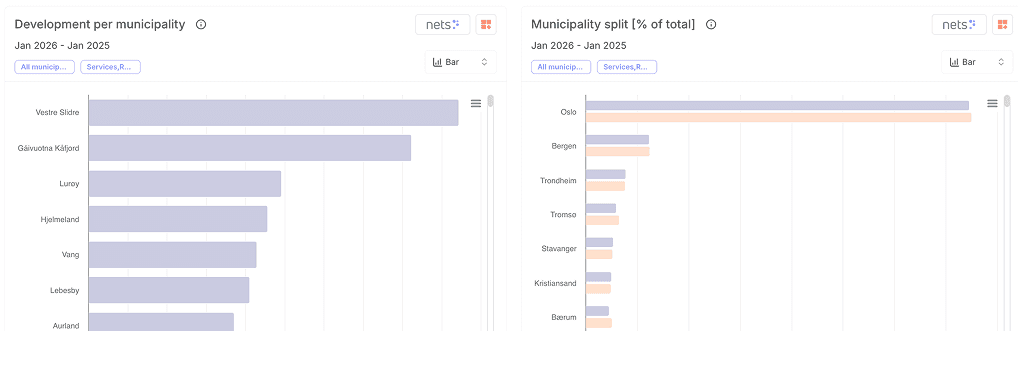
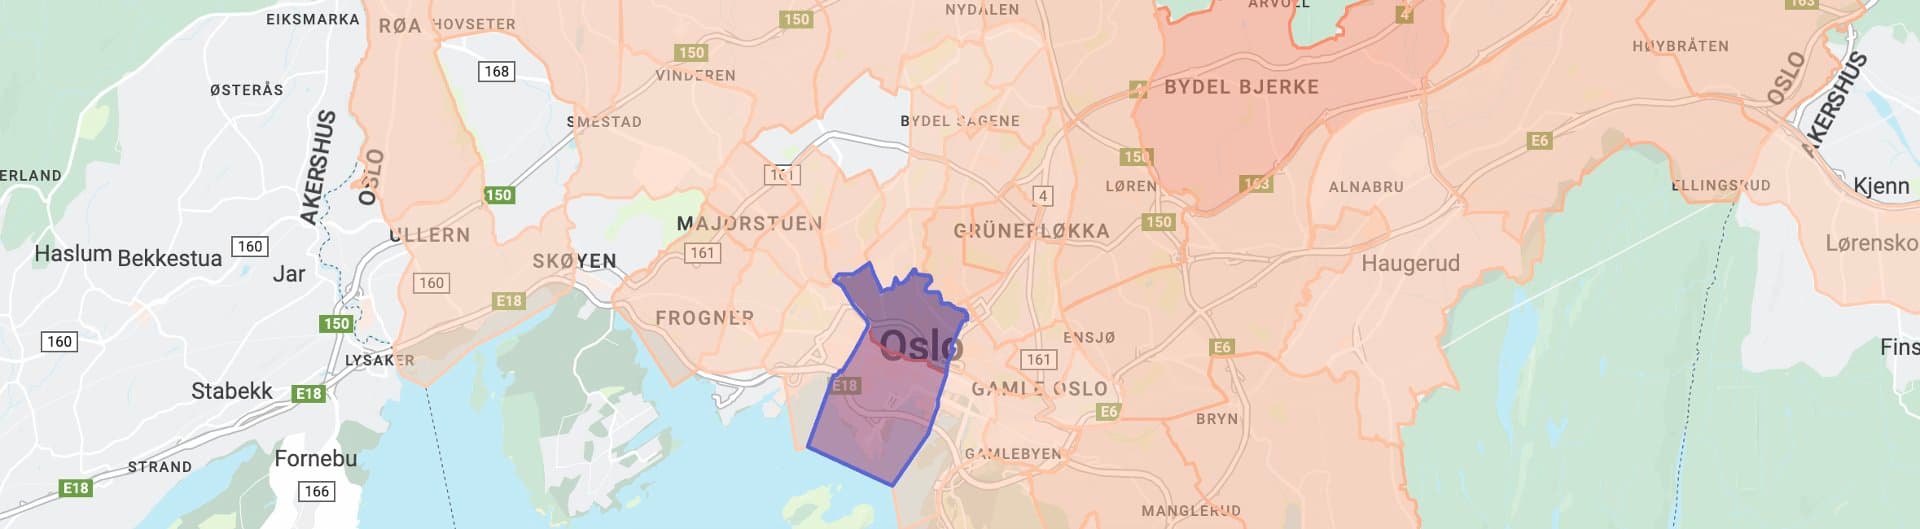
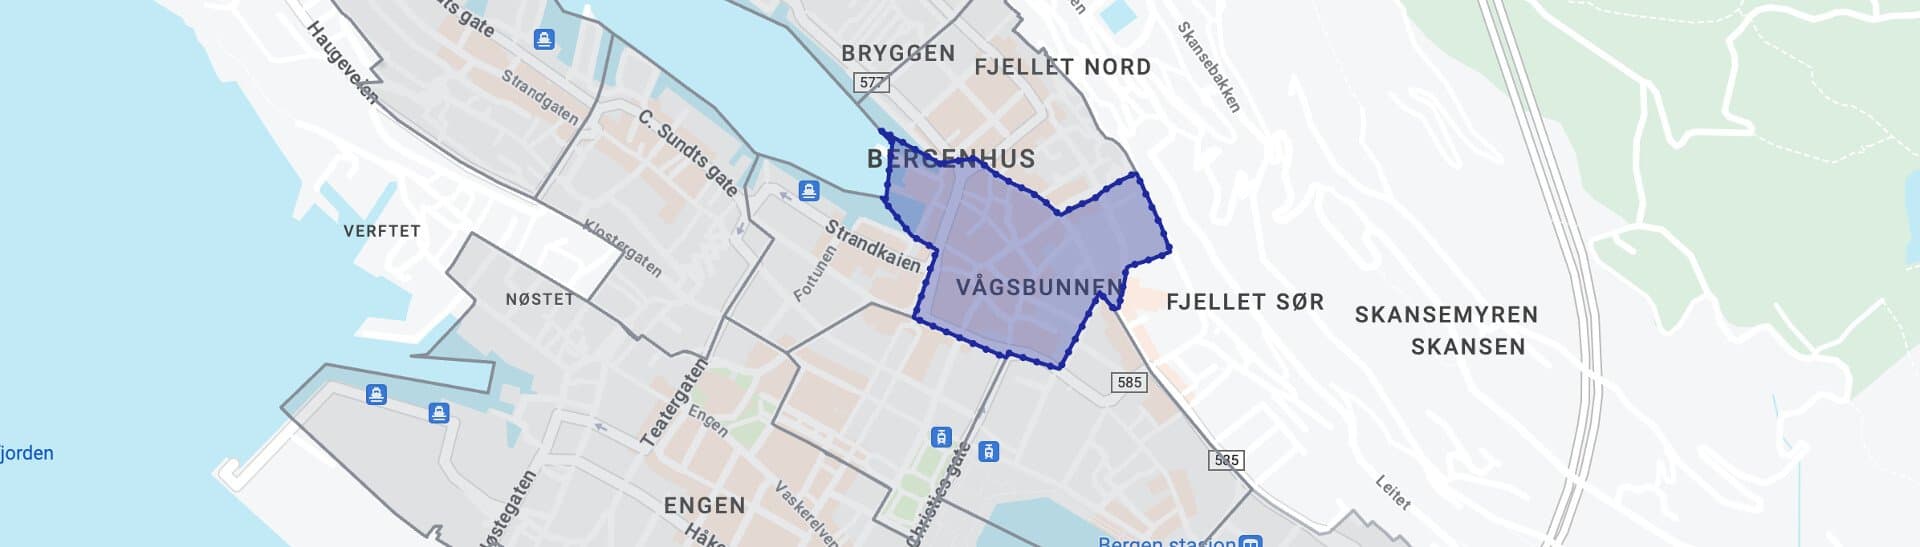
Geographic insights at the municipality level
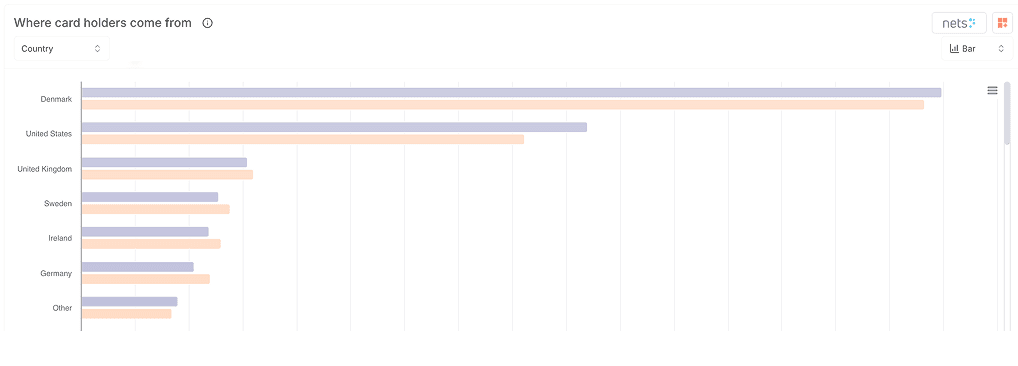
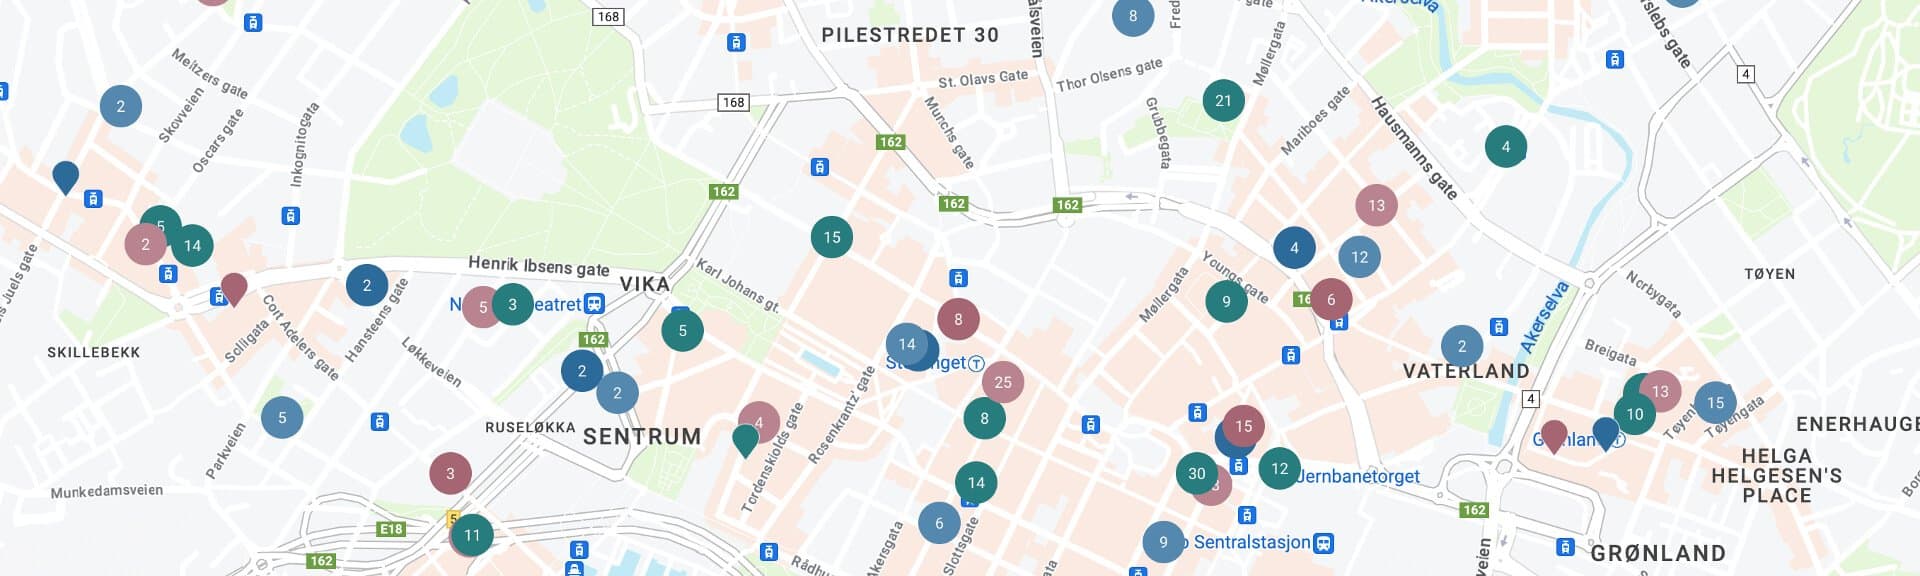
Origin of card usage
Who benefits from Nets data?
Shops and restaurants
Who want to analyse which shopping centres perform best, assess their own revenue in relation to these, and find the most profitable locations for new stores.
Real estate actors
Who want to benchmark their own centres against other players and gain better market understanding.
Advisors
Who assist clients with market analysis and location strategy.
Municipalities and urban planners
Who want to understand commercial areas and movement patterns.
FAQ
Related data and features
Movement
Unlock a world of insights with our datasets from Telia and Norlys, providing granular, timely and comprehensive insights into movement patterns.
Read more →
Spending
Dive into our BankAxept dataset, which offers comprehensive coverage of card transactions in Norway.
Read more →
Demographics
Explore population distribution, household types, income levels, and demographic trends.
Read more →
Competitive situation
Analyse competitors and concept mix, spot market gaps, and track area development with data from Prognosesenteret.
Read more →
Norwegian Mall Index
Get key metrics on Norwegian shopping malls — monthly turnover, visits, and trends in collaboration with Norsk Retail Hub.
Read more →